More on Barrel Tuners by Jerry Bennington Ph.D & Jim Bennington
In last month’s issue of Target Shooter (December 2013), we ran an article on barrel-tuners for fullbore rifles. Many of you will have heard of – or even used – tuners on rimfire rifles, where the shooter does not have the opportunity to ‘tune’ the ammunition. Using a tuner on long-range fullbore rifles is however a relatively new concept for many of us and we are indeed privileged to be able to share the experience and knowledge of Jim and Jerry Bennington who, in conjunction with gunsmith Eric Bosrtom have done much of the pioneering work on these tuners.
If you missed the previous article in the December issue, I strongly recommend you read it – it is available via our website at www.targetshooter.co.uk. If you are ready for part 2, read on……….
Introduction
If you are reading this article, you already are interested in increasing the confidence level in the decisions you make about loads, barrel selection, tuner settings or any of the many other choices need to get the most accuracy from a shooting system.
This article is a result of the earlier work by authors on barrel tuning, ‘Improved Rifle Accuracy’ previously published in Precision Shooting magazine and more recently in the December issue of Target Shooter. One of the challenges in analyzing the barrel tuners is to tease out the effect of the tuning from the other uncontrolled variables, e.g. wind, mirage, component variations and shooter errors that are present. Precision rifles, with well developed loads, shoot increasingly smaller groups, so how do we feel confident that the tuner setting is really ‘good enough?’
It is common for many of us to remember and brag about that great group your rifle shot on a previous trip to the range. We may also remember our winning bet in the office sweepstake but, neither one-time occurrence really makes you a pro.
When reviewing guns and ammunition, many shooting magazines will shoot five, 5-shot groups and list the maximum, minimum and average group sizes. Most readers would consider the best average to be a good indicator of testing. This is a good start and is easy to understand. However, if the averages are similar and, more importantly, the range of max/min ‘overlap’, then it isn’t so clear as to which combination is better.
Tuning with confidence
Jerry dusted off his statistics books from graduation school and suggested that ‘confidence intervals’ would give us a better measure to compare the tuner settings.
The statistical model for our shooting assumes that for each tuner setting (or other tuning parameters, e.g. powder load) the group-size we get from each sample is fixed average value (X) plus a random variation due to the uncontrollable factors – like barrel vibration, wind, etc.
The sample average is the estimate of the X and the sample standard deviation represents the estimate of the variation in the random component. With enough samples, the sample average will converge to the true value of X we are seeking. However, this may take too many samples to be practical.
Since each group is assumed to be independent, the likelihood of any individual group is characterized by the average and standard deviation. However, the sample average is based on all of the data and has a different behavior. We can calculate how likely it is that the true average X is close to the estimate from the sample average. This is called a ‘confidence interval’.
Looking in Wikipedia, you can find the following definition:
“In statistics, a confidence interval (CI) is a particular kind of interval estimate of a population parameter and is used to indicate the reliability of an estimate. It is an observed interval (i.e. it is calculated from the observations), in principle different from sample to sample, that frequently includes the parameter of interest, if the experiment is repeated. How frequently the observed interval contains the parameter is determined by the confidence level or confidence coefficient”.
The definitions sounds imposing but confidence intervals are actually pretty straightforward.
We will calculate the 95% confidence interval for the multiple two-shot groups for a given tuner setting. The confidence interval means that underlying true average X with this setting has a 95% probability of falling within the confidence interval. The length of the interval provides a measure of how good our sample average is. We will then plot the confidence intervals for the different settings for comparison purposes. Note that individual two-shot groups are likely to continue to fall outside of this interval, as discussed earlier.
You may recall from the prior article, we measured precision as the shot-to-shot variability, using a series of two-shot groups as a surrogate for shooting larger groups. Intuitively, a setting with the best two-shot group precision i.e. (shot to shot variability) should also have the smallest 5 or 10 shot groups as well.
This might be a good time to define precision – the ability to repeatedly place shots in a small group, whereas accuracy is the ability to hit what one is aiming at. Accuracy can be accomplished by adjusting the sights. Two-shot groups allow more samples for a given number of shots with the intent to minimize barrel wear during the testing. As we will see later, it also gives us more samples for the confidence interval estimate.
Precision match-grade rifle barrels often degrade in accuracy rapidly. For example, the first 500 shots may be the most accurate and the barrel is frequently worn out after less than 2000 rounds use in precision competitionshooting. For hunting, or other more casual shooting, the barrel may last forever. Note that in the example of barrel tuning that follows, we shot ~200 times to tune the barrel, which is a lot. An algorithm that tunes with less shooting is very desirable. Of course, one that gets the right answer is even better!
So how does this work out in practice? Consider the following example from some tuner testing last winter with my Eric Bostrom Custom Savage Model 12 Benchrest Dual Port 6BR on the 100 yard range at the Boulder Rifle Club in Colorado.
The rifle is set up to shoot in 1000 yard benchrest matches at the Colorado Rifle club and has a 28 inch 1:8 barrel with a ARM tuner. The factory stock didn’t ride the bags as well as the ‘tracker’ stock on my 6.5mm custom rifle. Fortunately, I had beautiful piece of walnut I had inherited from my dad that had seasoned for over 50 years. Eric is not only a gunsmith but a master cabinetmaker as well. He agreed to make me a custom stock with a dog-leg front-end and tracker rear. It turned out beautifully and rides the bags like a dream.
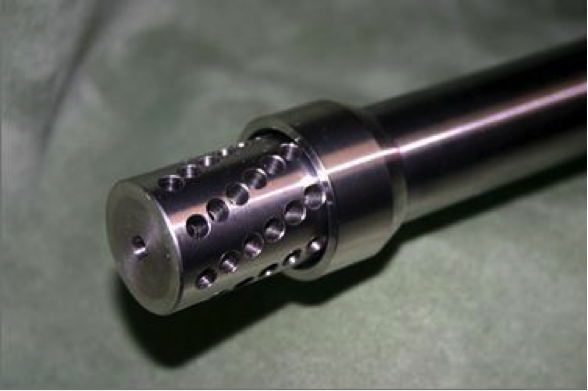
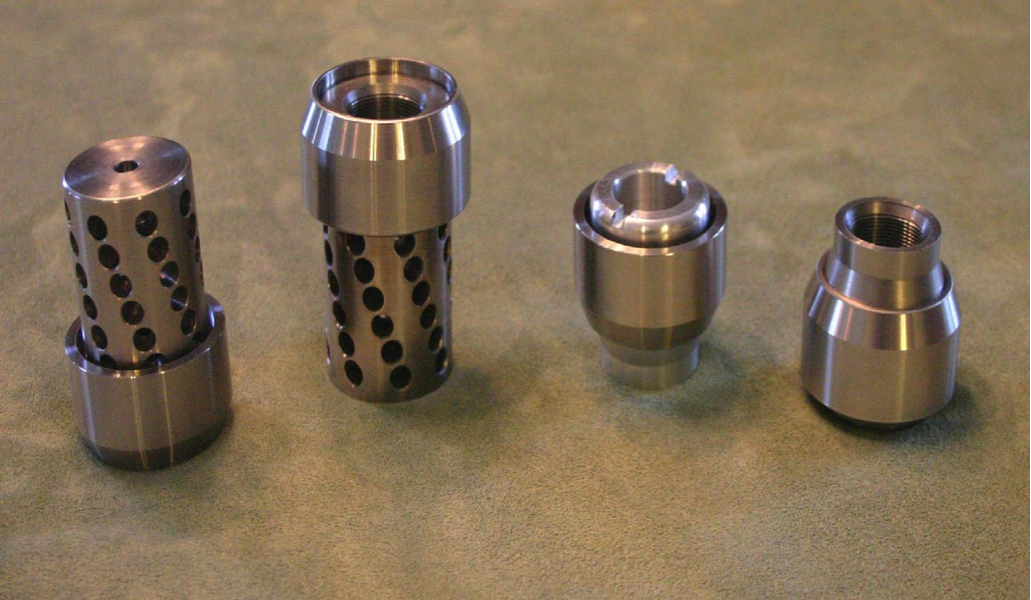
Fig.1 6mm ARM Tuner
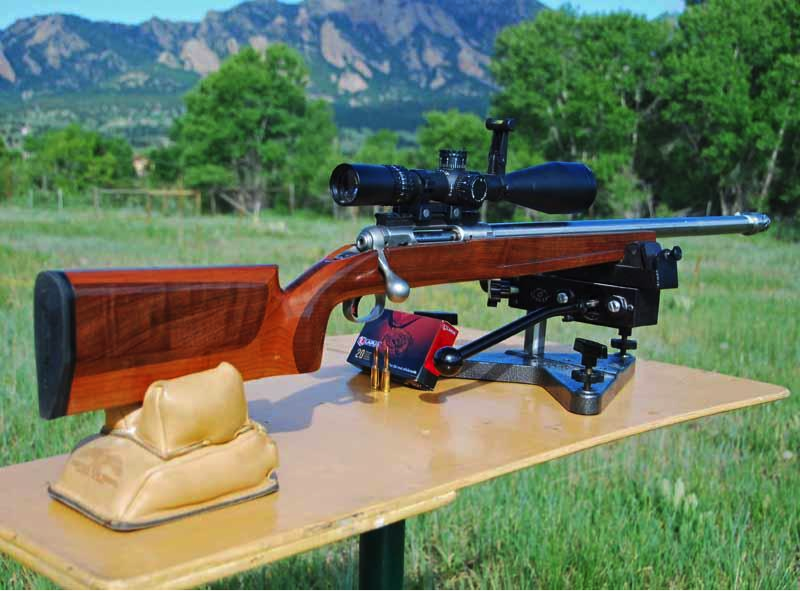 Fig.2 Eric Bostrom Custom Savage Model 12 Benchrest Dual Port 6BR
The first step in the tuning is to shoot single 2-shot groups over a wide range of settings: 80 to 150 in 10 degree increments. The results are shown below:
Table 1 – Worksheet for Tuner/Brake Test – Step 1 & 2
| Tuner Setting (deg) | 50 | 60 | 70 | 80 | 90 | 100 | 110 | 120 | 130 | 140 | 150 | 160 |
| Step1 | 0.25 | 0.255 | 0.383 | 0.373 | 0.167 | 0.739 | 0.163 | 0.191 | 0.082 | 0.24 | 0.165 | 0.326 |
| Step2 | 0.373 | 0.315 | 0.192 | 0.558 | 0.287 | 0.897 | ||||||
| Step2 | 0.5 | 0.8 | 0.337 | 0.453 | 0.333 | 0.249 | 0.129 |
The interval from 110 to 160 looked promising so two addition groups were shot over that range. Based on the second step, the range from 130 to 150 all look pretty good. How do we improve our confidence in using one of these tuner settings?
I shot three additional two-shot groups for the three tuner settings shown below:
Table 2 – Worksheet for Tuner/Brake Test – Step 3
| Tuner Setting | Group 1 | Group 2 | Group 3 | Group 4 | Group 5 | Group 6 | Min | Average | Max |
| 130 | 0.082 | 0.192 | 0.453 | 0.202 | 0.104 | 0.411 | 0.082 | 0.241 | 0.453 |
| 140 | 0.24 | 0.558 | 0.333 | 0.54 | 0.259 | 0.205 | 0.205 | 0.356 | 0.558 |
| 150 | 0.165 | 0.287 | 0.249 | 0.224 | 0.393 | 0.426 | 0.165 | 0.291 | 0.426 |
At first glance, the smallest group of 0.082 inches might temp us to prefer the setting of 130 since the average and maximum values are comparable for the other settings. But, the max/min interval ignores the other groups in the sample.
Let’s take a look at how the confidence interval would look like for the 130 setting. The confidence interval can be easily calculated in Excel using the ‘confidence’ function using the confidence level (typically 95%), the standard deviation and the number of samples collected. The confidence formula actually calculates the ‘half interval’ which is added and subtracted from the average to calculate the upper and lower limits for the confidence interval.
For this example, the standard deviation is 0.156 for our 6 two-shot groups. The Excel formula for Confidence (0.05, 0.156, 6) returns a value of 0.125. The confidence interval is then calculated as the average (0.241) plus and minus the 0.125 calculated earlier. Thus our sample of 6 two-shot groups for a setting of 130 indicates that true average has a 95% probability of lying within the interval 0.116 to 0.366 as shown below.
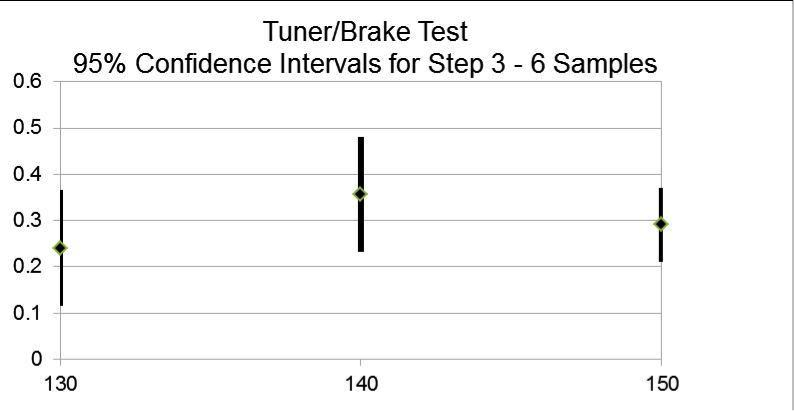
Fig. 3
Plotting these intervals, the effect of the smaller standard deviation for the 150 setting becomes apparent. Since the 130 and 150 settings have a substantial overlap, it is not clear that one is superior to the other based on the samples collected. This is promising but would more samples be even better? The results for 12 samples are shown below. In this case it would seem that the three settings converge to similar intervals, i.e. they all overlap and have about the same sample average.
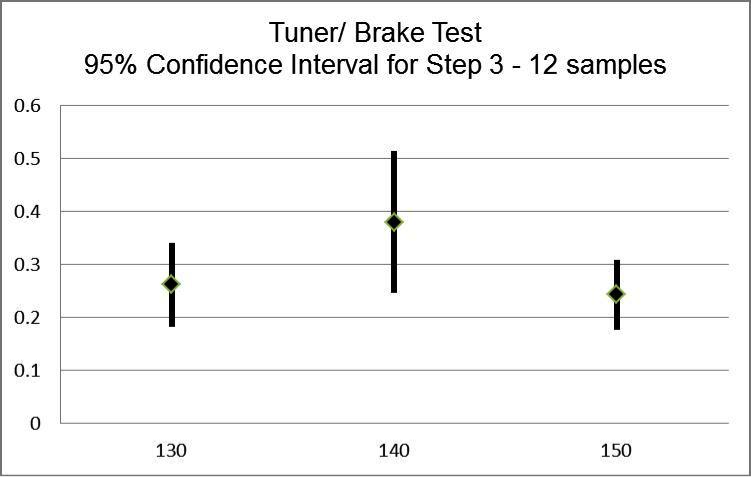
Fig. 4
What happened to the spread (max-min) for these tuner settings? Since they represent the best and worst groups the spread keeps getting bigger the more samples we take, i.e. we get a few ‘screamers’ and some ‘flyers’.
| Table 3 Tuner/Brake Test | ||
| Spread (max-min) | ||
| Tuner Setting | 6 Samples | 12 Samples |
| 130 | 0.371 | 0.385 |
| 140 | 0.353 | 0.938 |
| 150 | 0.261 | 0.366 |
The spread becomes less useful the more samples we take to improve our estimate of the average. In contrast, the confidence interval gets more precise in estimating true average for this setting is likely to occur.
For this application, six samples seemed to provide useable confidence intervals without excessive sample sizes. Remember, we want to have some barrel life left for next month’s match! The plots emphasized the promising settings while reminding us the overlapping intervals held promise as well.
Confidence intervals give you two parameters to use in tuning: the average and the interval. There is a trade-off between the size of the confidence interval and the average. You are trying to get the most consistent small 5 or 10 shot groups. It is not obvious exactly how the two parameters map into larger group sizes. That is a story for another day. If your ‘best setting’ has the lowest average and the interval doesn’t overlap with the intervals for the other settings, then it looks like a clear-cut winner. If they overlap, then you need to collect more data or pick the one you like (statistics won’t help you any more here).
Load development with confidence
The following example illustrates how this technique can be used for other ‘tuning’ applications. Once again I was shooting my Bostrom Custom Savage Model 12 6BR with a 28 inch Bartlien barrel with the ARM tuner. I wanted to test two powder loads and compare them to the Lapua Match factory ammo which had shot very well in the past. I shot six, 2-shot groups for each option: Lapua Match ammo (Factory), 30.6gr of RL 15 with the factory COAL and 30.6gr with 0.015in. and 0.030in. A sample target for the Lapua match ammo is shown below:
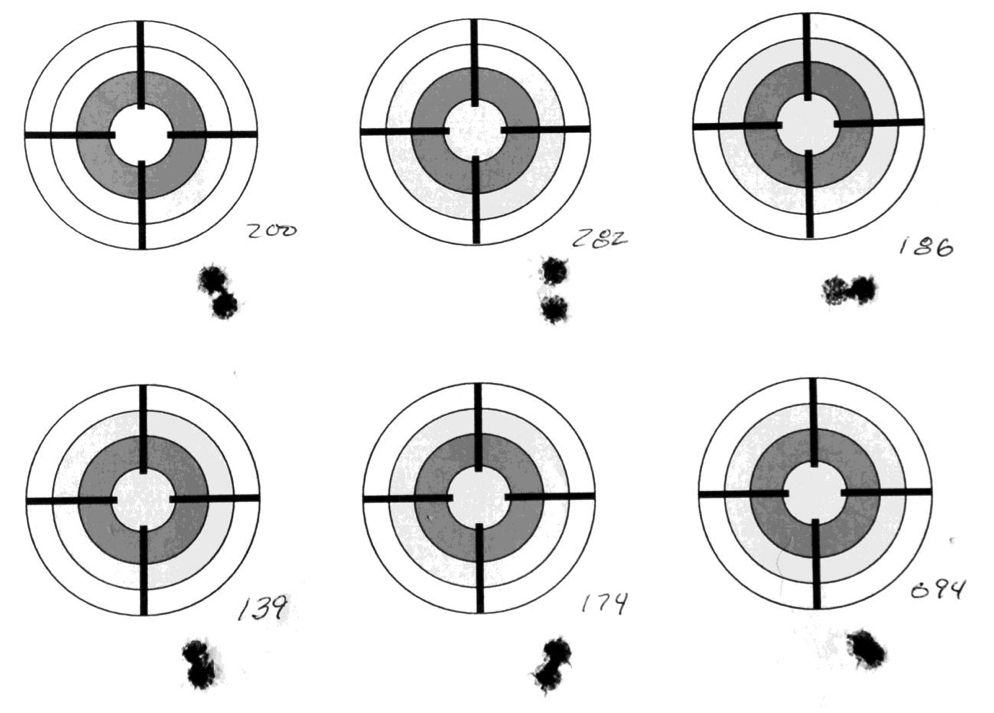
Fig. 5 2 Shot Groups for 28in. Bartlein with ARM Tuner – 105gr Lapua Match Ammo
The confidence intervals are shown below:
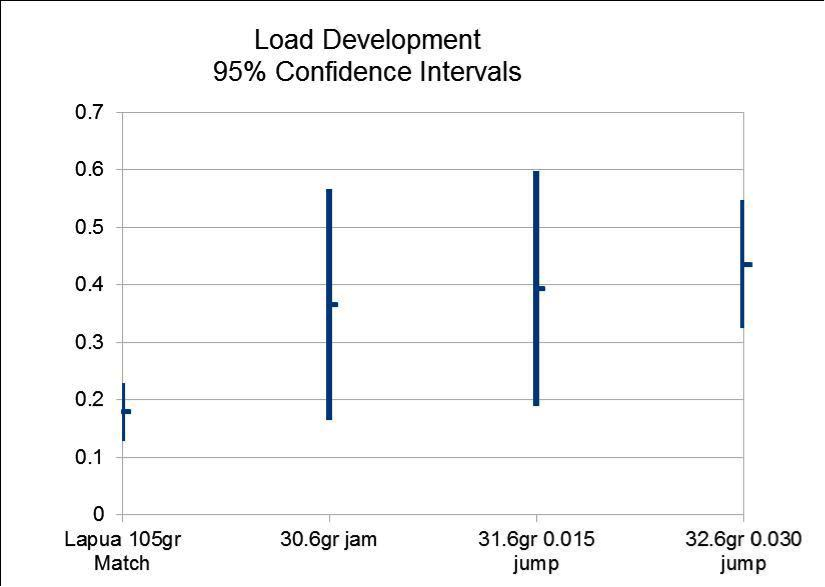
Fig. 6
In this case, the Lapua Match Ammo is clearly superior to the handloads in this comparison. It is time to go back to the loading bench.
Choosing a barrel with confidence
I have three match barrels in addition to the factory barrel that came with my Savage Model 12 rifle. The oldest is a 30 inch McGowen with an ARM tuner with several thousand rounds fired through it, the 28 inch Bartlein with an ARM tuner, a 30 inch Bartlein without a tuner and the 28 inch factory barrel are almost new. Using the ‘best loads’ for each barrel, the confidence intervals for the 2-shot groups are shown below. As suspected, it is time to retire the McGowen. Although not as good as the two Bartlein barrels, the factory barrel is remarkably good. Another testimonial to how accurate Savage rifles are as they come from the factory.
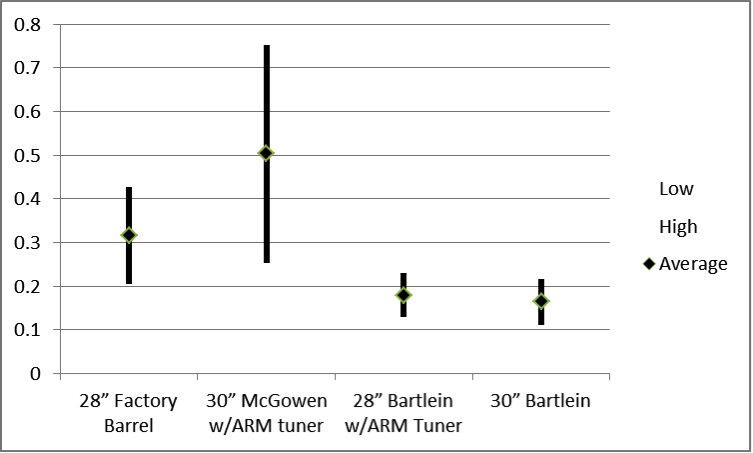
Fig. 7
Conclusion
The use of confidence intervals uses the statistics collected in rifle tuning to add a second parameter to use along with the average. The confidence interval provides a measure of the variability of the group size (or other measure) that is easily included with the average to pick the tuning parameter you want to use. Readers can contact Jerry at jerry@jbennington.com to get an Excel spreadsheet that calculates and plots the confidence intervals from your shooting data. Use it with confidence and good shooting.
APPENDIX:
Eric Bostrom-Myakka City, FL, 941-322-2487 www.bostromgunsmithing.com
ARM Tuners Precision Rifle Systems, LLC, – Myakka City, FL, 941-322-2487